SlideShare a Scribd company logo
1 of 4
Download to read offline
YEAR'S END 2008 AVERAGE RESIDENTIAL PRICES IN THE
DENVER METROLIST SYSTEM
YEAR ALL AREAS DSE SSE DEC/DHR/DHL
1974 $34,722 $36,668 $50,912 $36,291
1975 $35,921 $36,381 $52,938 $59,250
1976 $39,740 $43,195 $61,135 $60,925
1977 $44,876 $50,825 $67,072 $64,473
1978 $55,610 $64,650 $83,446 $77,178
1979 $66,051 $77,648 $96,058 $80,129
1980 $78,594 $97,128 $127,856 $94,337
1981 $83,893 $98,263 $149,426 $101,684
1982 $87,816 $105,454 $161,047 $108,409
1983 $90,346 $109,035 $169,407 $113,755
1984 $95,137 $112,423 $167,934 $132,430
1985 $95,447 $112,415 $160,672 $119,942
1986 $97,049 $113,650 $170,716 $137,264
1987 $102,773 $116,006 $171,634 $137,204
1988 $98,937 $114,095 $171,848 $127,303
1989 $103,868 $117,491 $173,571 $133,061
1990 $102,848 $120,200 $194,900 $151,544
1991 $109,071 $120,485 $207,658 $146,456
1992 $115,154 $127,078 $212,173 $154,699
1993 $126,168 $140,513 $251,099 $164,913
1994 $138,301 $156,144 $278,046 $184,909
1995 $150,736 $172,185 $292,631 $192,643
1996 $159,328 $185,406 $315,670 $193,398
1997 $169,587 $201,601 $315,143 $205,132
1998 $185,785 $226,862 $358,542 $211,589
1999 $208,296 $259,311 $433,756 $231,368
2000 $257,394 $325,126 $492,378 $305,952
2001 $239,779 $301,211 $506,959 $277,089
2002 $268,926 $348,850 $507,371 $315,375
2003 $279,279 $365,652 $497,179 $315,402
2004 $290,876 $387,094 $527,605 $342,193
2005 $309,047 $426,258 $602,644 $355,242
2006 $317,112 $468,266 $589,911 $361,927
2007 $310,418 $486,515 $595,345 $372,880
2008 $270,261 $461,630 $529,667 $362,328
$0
$100,000
$200,000
$300,000
$400,000
$500,000
$600,000
$700,000
1974
1976
1978
1980
1982
1984
1986
1988
1990
1992
1994
1996
1998
2000
2002
2004
2006
2008
Price
Date
History of Average Residential Prices in Denver Metro Area
ALL AREAS
DSE
SSE
DEC/DHR/DHL
Information obtained from sources believed to be reliable but not guaranteed. All data obtained from Metrolist, Inc. and compiled by
Tom Cryer, SCRP Broker Associate with The Kentwood Company.
Total # of Listings and Sales at Year's End 2008 Denver MLS System
YEAR LISTINGS SALES RATIO
Total Count Total Count
12/31/75 35,728 19,156 1.87 Potential negative market signal (Above 2.50)
12/31/76 40,223 24,354 1.65 Potential positive market signal (Below 2.00)
12/31/77 41,598 29,875 1.39 Potential neutral market signal (Between 2.00 & 2.50)
12/31/78 49,675 31,213 1.59 Too soon to tell // Year to date // Inconclusive
12/31/79 59,384 31,024 1.91 Indicates all time high or low
12/31/80 55,438 23,952 2.31
12/31/81 49,755 22,125 2.25
12/31/82 52,817 18,756 2.82
12/31/83 63,585 23,566 2.70
12/31/84 69,041 23,264 2.97
12/31/85 73,279 24,489 2.99
12/31/86 75,694 25,865 2.93
12/31/87 69,740 23,414 2.98
12/31/88 62,521 24,120 2.59
12/31/89 50,112 25,142 1.99
12/31/90 53,682 26,436 2.03
12/31/91 53,286 27,375 1.95
12/31/92 48,103 34,828 1.38
12/31/93 69,118 40,291 1.72
12/31/94 73,637 40,068 1.84
12/31/95 78,969 37,767 2.09
12/31/96 84,909 39,849 2.13
Information obtained from sources believed to be reliable but not guaranteed. All data obtained from year to date statistics provided by
Metrolist, Inc. and compiled by Tom Cryer, SCRP Broker Associate with The Kentwood Company
, ,
12/31/97 90,813 41,959 2.16
12/31/98 103,402 47,836 2.16
12/31/99 72,842 48,795 1.49
12/31/00 100,672 50,499 1.99
12/31/01 133,688 49,372 2.71
12/27/02 138,445 49,326 2.81
12/29/03 123,596 47,731 2.59
12/31/04 127,989 53,710 2.38
12/31/05 135,008 54,072 2.50
12/31/06 152,807 52,220 2.93
12/31/07 143,400 51,304 2.80
12/31/08 123,655 48,926 2.53
7/1/2008 (EST) LISTINGS SALES RATIO
Res 92,226 37,988 2.43
Cond 24,728 9,849 2.51
Land 4,288 561 7.64
Inc 2,373 528 4.49
Totals 123,615 48,926 2.53
0.00
1.00
2.00
3.00
4.00
1975 1977 1979 1981 1983 1985 1987 1989 1991 1993 1995 1997 1999 2001 2003 2005 2007
Ratio
Date
Ratio of Listings to Sales
Information obtained from sources believed to be reliable but not guaranteed. All data obtained from year to date statistics provided by
Metrolist, Inc. and compiled by Tom Cryer, SCRP Broker Associate with The Kentwood Company
SFR MARKET SHARE BY PRICE RANGE AS OF YEAR END 2008
LISTING RANGES ACTIVE LISTINGS UNDER CONTRACT SALES % MKT SHARE
ALL PRICES 15,404 3,702 37,902 100.00%
$0k-400k 9,714 3,249 32,217 85.00%
$401-750k 3,424 353 4,634 12.23%
$751-1M 979 55 658 1.74%
$1M + 1,393 54 558 1.47%
100.44%
MONTHS SUPPLY OF SFR INVENTORY
LISTING RANGES TOTAL # SALES MONTHS SUPPLY
ALL PRICES 37,902 4.88
$0k-400k 32217 3.62
$401-750k 4634 8.87
$751-1M 658 17.85
$1M + 558 29.96
HISTORY OF FORECLOSURE ACTIVITY BY COUNTY IN DENVER METRO YEAR END 2008
20000
25000
30000
35000
Arapahoe County
Jefferson County
Denver County
Douglas County
Boulder County
Adams County
0
5000
10000
15000
Year1972197419761978198019821984198619881990199219941996199820002002200420062008
y
Total Metro Area

More Related Content

More from Tom Cryer

AVERAGE PRICE HISTORY LAST THREE YEARS IN GREENWOOD VILLAGE, COLORADO
AVERAGE PRICE HISTORY LAST THREE YEARS IN GREENWOOD VILLAGE, COLORADOAVERAGE PRICE HISTORY LAST THREE YEARS IN GREENWOOD VILLAGE, COLORADO
AVERAGE PRICE HISTORY LAST THREE YEARS IN GREENWOOD VILLAGE, COLORADOTom Cryer
 
Denver, Colorado Monthly Mls Stats 2010
Denver, Colorado Monthly Mls Stats 2010Denver, Colorado Monthly Mls Stats 2010
Denver, Colorado Monthly Mls Stats 2010Tom Cryer
 
Weekly Economic Financial Commentary March 26, 2010
Weekly Economic Financial Commentary March 26, 2010Weekly Economic Financial Commentary March 26, 2010
Weekly Economic Financial Commentary March 26, 2010Tom Cryer
 
It Pays to Buy Now!
It Pays to Buy Now!It Pays to Buy Now!
It Pays to Buy Now!Tom Cryer
 
Cherry Hills Village March 2010
Cherry Hills Village March 2010Cherry Hills Village March 2010
Cherry Hills Village March 2010Tom Cryer
 
DENVER MARKET WATCH YEAR END 2009
DENVER MARKET WATCH YEAR END 2009DENVER MARKET WATCH YEAR END 2009
DENVER MARKET WATCH YEAR END 2009Tom Cryer
 
February Foreclosure List for Denver, Colorado
February Foreclosure List for Denver, ColoradoFebruary Foreclosure List for Denver, Colorado
February Foreclosure List for Denver, ColoradoTom Cryer
 
Wells Fargo 2010 Annual Outlook
Wells Fargo 2010 Annual OutlookWells Fargo 2010 Annual Outlook
Wells Fargo 2010 Annual OutlookTom Cryer
 
A COMPREHENSIVE ANALYSIS OF $1M+ TRANSACTIONS IN THE DENVER METRO AREA AS OF ...
A COMPREHENSIVE ANALYSIS OF $1M+ TRANSACTIONS IN THE DENVER METRO AREA AS OF ...A COMPREHENSIVE ANALYSIS OF $1M+ TRANSACTIONS IN THE DENVER METRO AREA AS OF ...
A COMPREHENSIVE ANALYSIS OF $1M+ TRANSACTIONS IN THE DENVER METRO AREA AS OF ...Tom Cryer
 
University Hills Denver, CO Real Estate Report
University Hills Denver, CO Real Estate ReportUniversity Hills Denver, CO Real Estate Report
University Hills Denver, CO Real Estate ReportTom Cryer
 
2009 Us Corporate Relocation Benchmarking Survey
2009 Us Corporate Relocation Benchmarking Survey2009 Us Corporate Relocation Benchmarking Survey
2009 Us Corporate Relocation Benchmarking SurveyTom Cryer
 
University of Denver Community Residential Real Estate Trends
University of Denver Community Residential Real Estate TrendsUniversity of Denver Community Residential Real Estate Trends
University of Denver Community Residential Real Estate TrendsTom Cryer
 
Mortgage Brokers Association Data
Mortgage Brokers Association DataMortgage Brokers Association Data
Mortgage Brokers Association DataTom Cryer
 
Defeating Procrastination
Defeating ProcrastinationDefeating Procrastination
Defeating ProcrastinationTom Cryer
 
Economic Summary September, 2009
Economic Summary September, 2009Economic Summary September, 2009
Economic Summary September, 2009Tom Cryer
 
Internet Security
Internet SecurityInternet Security
Internet SecurityTom Cryer
 
Price To Income Ratio
Price To Income RatioPrice To Income Ratio
Price To Income RatioTom Cryer
 
The Moral Sources Of Capitalism
The Moral Sources Of CapitalismThe Moral Sources Of Capitalism
The Moral Sources Of CapitalismTom Cryer
 
Saving For Peace Of Mind
Saving For Peace Of MindSaving For Peace Of Mind
Saving For Peace Of MindTom Cryer
 

More from Tom Cryer (20)

AVERAGE PRICE HISTORY LAST THREE YEARS IN GREENWOOD VILLAGE, COLORADO
AVERAGE PRICE HISTORY LAST THREE YEARS IN GREENWOOD VILLAGE, COLORADOAVERAGE PRICE HISTORY LAST THREE YEARS IN GREENWOOD VILLAGE, COLORADO
AVERAGE PRICE HISTORY LAST THREE YEARS IN GREENWOOD VILLAGE, COLORADO
 
Denver, Colorado Monthly Mls Stats 2010
Denver, Colorado Monthly Mls Stats 2010Denver, Colorado Monthly Mls Stats 2010
Denver, Colorado Monthly Mls Stats 2010
 
Weekly Economic Financial Commentary March 26, 2010
Weekly Economic Financial Commentary March 26, 2010Weekly Economic Financial Commentary March 26, 2010
Weekly Economic Financial Commentary March 26, 2010
 
It Pays to Buy Now!
It Pays to Buy Now!It Pays to Buy Now!
It Pays to Buy Now!
 
Cherry Hills Village March 2010
Cherry Hills Village March 2010Cherry Hills Village March 2010
Cherry Hills Village March 2010
 
DENVER MARKET WATCH YEAR END 2009
DENVER MARKET WATCH YEAR END 2009DENVER MARKET WATCH YEAR END 2009
DENVER MARKET WATCH YEAR END 2009
 
February Foreclosure List for Denver, Colorado
February Foreclosure List for Denver, ColoradoFebruary Foreclosure List for Denver, Colorado
February Foreclosure List for Denver, Colorado
 
Wells Fargo 2010 Annual Outlook
Wells Fargo 2010 Annual OutlookWells Fargo 2010 Annual Outlook
Wells Fargo 2010 Annual Outlook
 
A COMPREHENSIVE ANALYSIS OF $1M+ TRANSACTIONS IN THE DENVER METRO AREA AS OF ...
A COMPREHENSIVE ANALYSIS OF $1M+ TRANSACTIONS IN THE DENVER METRO AREA AS OF ...A COMPREHENSIVE ANALYSIS OF $1M+ TRANSACTIONS IN THE DENVER METRO AREA AS OF ...
A COMPREHENSIVE ANALYSIS OF $1M+ TRANSACTIONS IN THE DENVER METRO AREA AS OF ...
 
University Hills Denver, CO Real Estate Report
University Hills Denver, CO Real Estate ReportUniversity Hills Denver, CO Real Estate Report
University Hills Denver, CO Real Estate Report
 
2009 Us Corporate Relocation Benchmarking Survey
2009 Us Corporate Relocation Benchmarking Survey2009 Us Corporate Relocation Benchmarking Survey
2009 Us Corporate Relocation Benchmarking Survey
 
University of Denver Community Residential Real Estate Trends
University of Denver Community Residential Real Estate TrendsUniversity of Denver Community Residential Real Estate Trends
University of Denver Community Residential Real Estate Trends
 
Mortgage Brokers Association Data
Mortgage Brokers Association DataMortgage Brokers Association Data
Mortgage Brokers Association Data
 
Defeating Procrastination
Defeating ProcrastinationDefeating Procrastination
Defeating Procrastination
 
Economic Summary September, 2009
Economic Summary September, 2009Economic Summary September, 2009
Economic Summary September, 2009
 
Internet Security
Internet SecurityInternet Security
Internet Security
 
Unglaublich
UnglaublichUnglaublich
Unglaublich
 
Price To Income Ratio
Price To Income RatioPrice To Income Ratio
Price To Income Ratio
 
The Moral Sources Of Capitalism
The Moral Sources Of CapitalismThe Moral Sources Of Capitalism
The Moral Sources Of Capitalism
 
Saving For Peace Of Mind
Saving For Peace Of MindSaving For Peace Of Mind
Saving For Peace Of Mind
 

Master Year End Market Watch Year End 2008

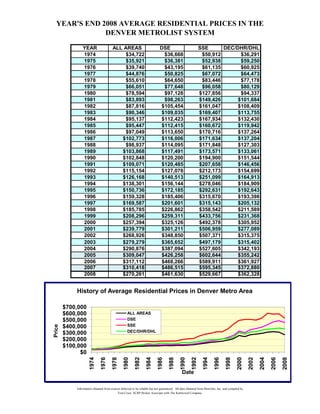
  • 1. YEAR'S END 2008 AVERAGE RESIDENTIAL PRICES IN THE DENVER METROLIST SYSTEM YEAR ALL AREAS DSE SSE DEC/DHR/DHL 1974 $34,722 $36,668 $50,912 $36,291 1975 $35,921 $36,381 $52,938 $59,250 1976 $39,740 $43,195 $61,135 $60,925 1977 $44,876 $50,825 $67,072 $64,473 1978 $55,610 $64,650 $83,446 $77,178 1979 $66,051 $77,648 $96,058 $80,129 1980 $78,594 $97,128 $127,856 $94,337 1981 $83,893 $98,263 $149,426 $101,684 1982 $87,816 $105,454 $161,047 $108,409 1983 $90,346 $109,035 $169,407 $113,755 1984 $95,137 $112,423 $167,934 $132,430 1985 $95,447 $112,415 $160,672 $119,942 1986 $97,049 $113,650 $170,716 $137,264 1987 $102,773 $116,006 $171,634 $137,204 1988 $98,937 $114,095 $171,848 $127,303 1989 $103,868 $117,491 $173,571 $133,061 1990 $102,848 $120,200 $194,900 $151,544 1991 $109,071 $120,485 $207,658 $146,456 1992 $115,154 $127,078 $212,173 $154,699 1993 $126,168 $140,513 $251,099 $164,913 1994 $138,301 $156,144 $278,046 $184,909 1995 $150,736 $172,185 $292,631 $192,643 1996 $159,328 $185,406 $315,670 $193,398 1997 $169,587 $201,601 $315,143 $205,132 1998 $185,785 $226,862 $358,542 $211,589 1999 $208,296 $259,311 $433,756 $231,368 2000 $257,394 $325,126 $492,378 $305,952 2001 $239,779 $301,211 $506,959 $277,089 2002 $268,926 $348,850 $507,371 $315,375 2003 $279,279 $365,652 $497,179 $315,402 2004 $290,876 $387,094 $527,605 $342,193 2005 $309,047 $426,258 $602,644 $355,242 2006 $317,112 $468,266 $589,911 $361,927 2007 $310,418 $486,515 $595,345 $372,880 2008 $270,261 $461,630 $529,667 $362,328 $0 $100,000 $200,000 $300,000 $400,000 $500,000 $600,000 $700,000 1974 1976 1978 1980 1982 1984 1986 1988 1990 1992 1994 1996 1998 2000 2002 2004 2006 2008 Price Date History of Average Residential Prices in Denver Metro Area ALL AREAS DSE SSE DEC/DHR/DHL Information obtained from sources believed to be reliable but not guaranteed. All data obtained from Metrolist, Inc. and compiled by Tom Cryer, SCRP Broker Associate with The Kentwood Company.
  • 2. Total # of Listings and Sales at Year's End 2008 Denver MLS System YEAR LISTINGS SALES RATIO Total Count Total Count 12/31/75 35,728 19,156 1.87 Potential negative market signal (Above 2.50) 12/31/76 40,223 24,354 1.65 Potential positive market signal (Below 2.00) 12/31/77 41,598 29,875 1.39 Potential neutral market signal (Between 2.00 & 2.50) 12/31/78 49,675 31,213 1.59 Too soon to tell // Year to date // Inconclusive 12/31/79 59,384 31,024 1.91 Indicates all time high or low 12/31/80 55,438 23,952 2.31 12/31/81 49,755 22,125 2.25 12/31/82 52,817 18,756 2.82 12/31/83 63,585 23,566 2.70 12/31/84 69,041 23,264 2.97 12/31/85 73,279 24,489 2.99 12/31/86 75,694 25,865 2.93 12/31/87 69,740 23,414 2.98 12/31/88 62,521 24,120 2.59 12/31/89 50,112 25,142 1.99 12/31/90 53,682 26,436 2.03 12/31/91 53,286 27,375 1.95 12/31/92 48,103 34,828 1.38 12/31/93 69,118 40,291 1.72 12/31/94 73,637 40,068 1.84 12/31/95 78,969 37,767 2.09 12/31/96 84,909 39,849 2.13 Information obtained from sources believed to be reliable but not guaranteed. All data obtained from year to date statistics provided by Metrolist, Inc. and compiled by Tom Cryer, SCRP Broker Associate with The Kentwood Company , , 12/31/97 90,813 41,959 2.16 12/31/98 103,402 47,836 2.16 12/31/99 72,842 48,795 1.49 12/31/00 100,672 50,499 1.99 12/31/01 133,688 49,372 2.71 12/27/02 138,445 49,326 2.81 12/29/03 123,596 47,731 2.59 12/31/04 127,989 53,710 2.38 12/31/05 135,008 54,072 2.50 12/31/06 152,807 52,220 2.93 12/31/07 143,400 51,304 2.80 12/31/08 123,655 48,926 2.53 7/1/2008 (EST) LISTINGS SALES RATIO Res 92,226 37,988 2.43 Cond 24,728 9,849 2.51 Land 4,288 561 7.64 Inc 2,373 528 4.49 Totals 123,615 48,926 2.53 0.00 1.00 2.00 3.00 4.00 1975 1977 1979 1981 1983 1985 1987 1989 1991 1993 1995 1997 1999 2001 2003 2005 2007 Ratio Date Ratio of Listings to Sales Information obtained from sources believed to be reliable but not guaranteed. All data obtained from year to date statistics provided by Metrolist, Inc. and compiled by Tom Cryer, SCRP Broker Associate with The Kentwood Company
  • 3. SFR MARKET SHARE BY PRICE RANGE AS OF YEAR END 2008 LISTING RANGES ACTIVE LISTINGS UNDER CONTRACT SALES % MKT SHARE ALL PRICES 15,404 3,702 37,902 100.00% $0k-400k 9,714 3,249 32,217 85.00% $401-750k 3,424 353 4,634 12.23% $751-1M 979 55 658 1.74% $1M + 1,393 54 558 1.47% 100.44% MONTHS SUPPLY OF SFR INVENTORY LISTING RANGES TOTAL # SALES MONTHS SUPPLY ALL PRICES 37,902 4.88 $0k-400k 32217 3.62 $401-750k 4634 8.87 $751-1M 658 17.85 $1M + 558 29.96
  • 4. HISTORY OF FORECLOSURE ACTIVITY BY COUNTY IN DENVER METRO YEAR END 2008 20000 25000 30000 35000 Arapahoe County Jefferson County Denver County Douglas County Boulder County Adams County 0 5000 10000 15000 Year1972197419761978198019821984198619881990199219941996199820002002200420062008 y Total Metro Area